Climate change does affect poverty: results from a big data analysis
Temperature variability can be linked to poverty – our Data Innovation team has evidence that could help world leaders at UNGA accelerate the Sustainable Development Goals.
-
Date
January 2023
-
Area of expertiseResearch and Evidence (R&E)
-
KeywordsImpact evaluation , Quantitative methods , Data Innovation , Monitoring, Evaluation, and Learning (MEL) , Research Management , Quantitative impact evaluations (QIE) , Quasi-experimental , Randomised Control Trials (RCTs) , Social Media Listening
Extreme weather events have been a prevalent topic throughout the year, ensuring the issue of climate change remains at the forefront of global discussions. With UNGA currently underway and with the anticipation of COP28 on the horizon, climate change remains a critical concern. Often, those who bear the brunt of these events are also the most economically vulnerable. As policymakers contemplate the climatic risks that impact poverty, we offer a valuable insight gleaned from our big data analysis: the role of temperature variability.
When we first wrote about this, in a blog post about a year ago, we considered channels through which temperature variability could affect economic outcomes in developing countries – and suggested that big data can help understand these better. We then used the past twelve months to implement a research project using two large datasets to estimate the relationship between temperature variability and economic wellbeing of households in LMICs.
Fast forward to today, we have preliminary results which have found strong and consistent evidence that there is a negative impact of day-to-day temperature variability on wealth in LMICs – plus maps showing how granular the data is.
A dive into the data
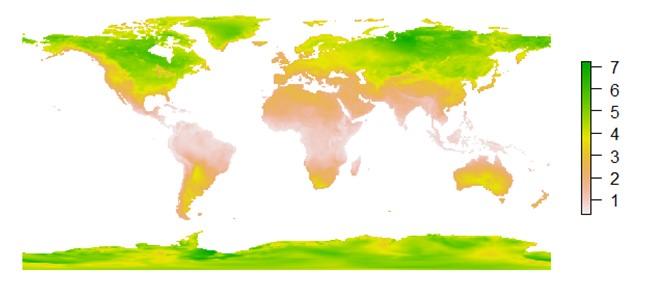
We all know that daily temperatures fluctuate – but how do you actually measure that? We rely on high resolution remote sensing temperature data. This data is also extremely high frequency – coming from remote sensors that orbit the earth and take measurements of temperature every hour. We define day-to-day temperature variability as deviations of daily temperatures from their monthly means, averaged for 2018 – to match the year of our poverty data. In Figure 1, we map day-to-day temperature variability across the world: higher values are green, lower values in red. There is a strong longitudinal dependence - the further we move away from the equator, the higher the temperature variability.
Figure 1 Day-to-day temperature variability across the world (in Kelvins)

If the remote earth sensors sounded futuristic– then the poverty data is like time travelling to 2100. But the future is closer than you think. In early 2022, researchers from Berkeley University in the US used machine learning (ML) to predict household wealth for 135 LMICs at 2.4 km spatial resolution and published the resulting big dataset. What went into the ML algorithm? Among other things connectivity data from Facebook (de-identified), satellite images, and demographic maps – but the ‘ground truth’ data came from household surveys. The measure of wealth is an asset-based Relative Wealth Index (RWI), which tells us how wealthy each grid cell is relative to other locations within the country. This data is cross-sectional, meaning it shows the relative wealth in LMICs for 2018 only.
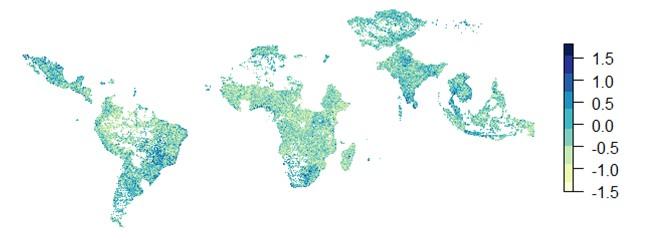
That’s all exciting and very sci-fi like but are these estimates accurate? The authors validate their results by comparing estimates to measurements from external data sources (including household data from Kenya, Togo, and Nigeria), finding that their estimates explain up to 86% of variation in the ground-truth data. The researchers also provide us with a measure of uncertainty for their estimates for each grid cell, i.e. of how sure they are that they are predicting poverty accurately. Figure 2 presents these resulting estimates – each dot on the map is a 2.4km grid cell with predicted RWI values. Darker values show higher relative wealth.
Figure 2 Micro estimates of wealth at 2.4 km resolution

Though we are working with two high resolution datasets, there is one problem – they are at a different spatial resolution. The first step is to aggregate the poverty data to the right grid-cell resolution so that we can build one large dataset with over 18,594 observations on both poverty and temperature variability across 89 countries. Once we have that, it’s analysis time. To exploit the rich spatial variation in our data and minimise omitted variable bias, we applied a so-called 'spatial first difference' (SFD) approach to causal inference, controlling for rainfall and seasonal temperature variability. We implement several different robustness checks – including re-estimating the relationship between temperature variability and poverty using only grid cells where the measure of prediction uncertainty is low.
Reliable results
The punchline is as follows: we find solid and reliable evidence that higher temperature variability is associated with lower wealth levels in LMICs. This result holds across a variety of different estimations and robustness checks. A one unit increase in the degree of temperature variability is associated, on average, with a 0.187 unit reduction in relative household wealth. To put this number into perspective – the relative wealth index is determined on a scale of around -1.5 to 1.5 (see Figure 2). In line with other studies that rely on the same temperature dataset, we find that this relationship is stronger at lower latitudes.
What does this mean for climate change policies around the world?
Finding yet another way in which climate change has negative economic consequences certainly does feel alarming. But it is also mobilising – now that we can no longer blame lack of evidence for inaction, eyes are on the policymakers, grassroot communities, and frankly everyone to tackle these negative effects. Working in partnership with the most affected communities will be key to understanding the impact of climatic shocks on their livelihoods, and what solutions might be available. Our research shows robust evidence that increases in temperature variability lower relative wealth – and that high-resolution estimates of poverty, derived from ML algorithms, can be used in downstream research to investigate policy-relevant questions. But temperature variability is not an isolated policy question. Higher concentrations of greenhouse gases are projected to increase temperature variability, which means if we don’t reach the target of restricting global warming to 1.5 degrees agreed at COP21 in Paris – we will be dealing with the double trouble of higher absolute temperatures, and higher variability.
So what can be done? Given higher climate variability is also closely linked to more uncertainty, which will hit poor households in LMICs particularly hard – there is a need for well-functioning programmes to insure against climatic risk. Some examples from LMICs come to mind – most notably livestock insurance schemes that protect farmers from drought in Ethiopia. Policy makers across the world will need to tackle the negative effects that increases in temperature variability have by developing innovative policy instruments – and communities need to hold them accountable.
About the authors:
Paul Jasper is a Principal Consultant and Data Innovation Lead at Oxford Policy Management.
Ida Brzezinska is an Assistant Consultant in the Data Innovation team at Oxford Policy Management.


